General

Objective: Enable MoE staff and partners to confidently use digital tools for collecting, managing, and communicating EiE data, even in low-resource settings
Unit 4: Data Visualization & Reporting in Microsoft Tools
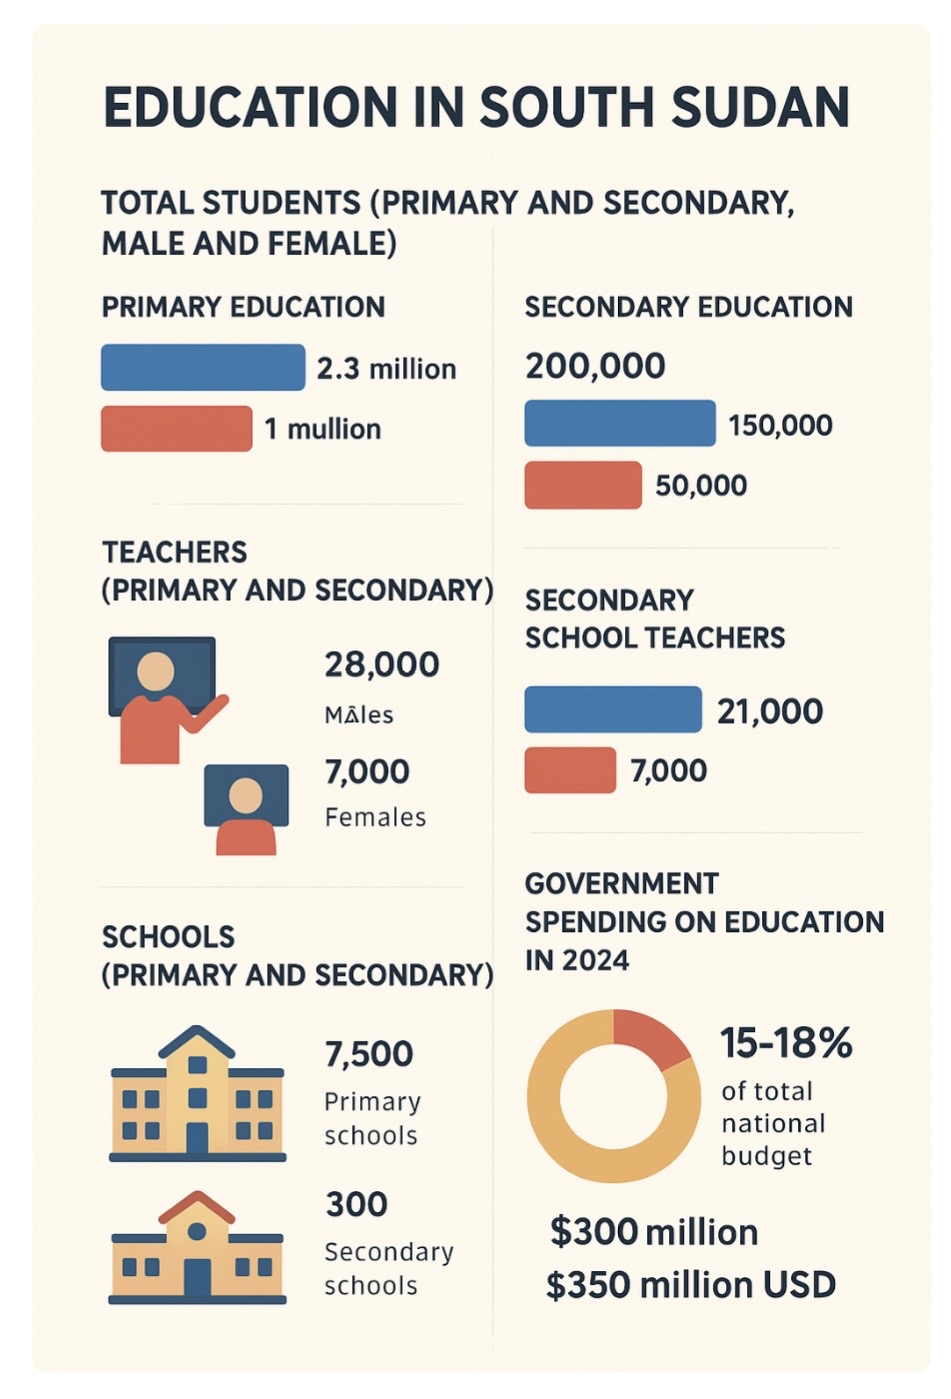
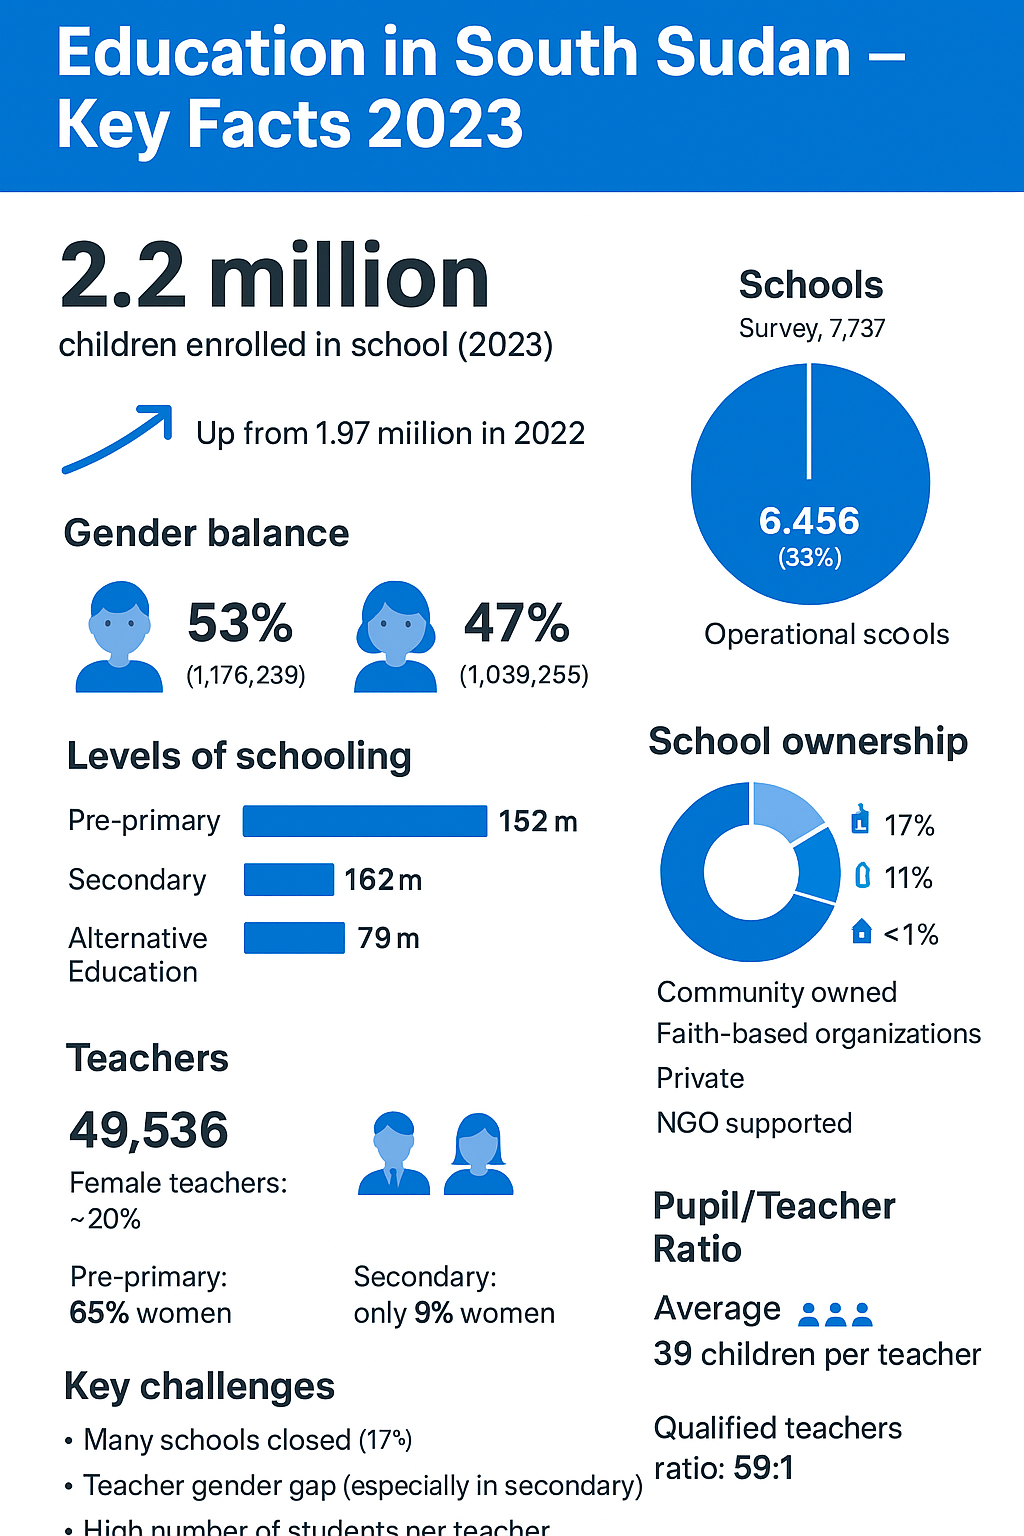
- Creating charts and graphs in Excel
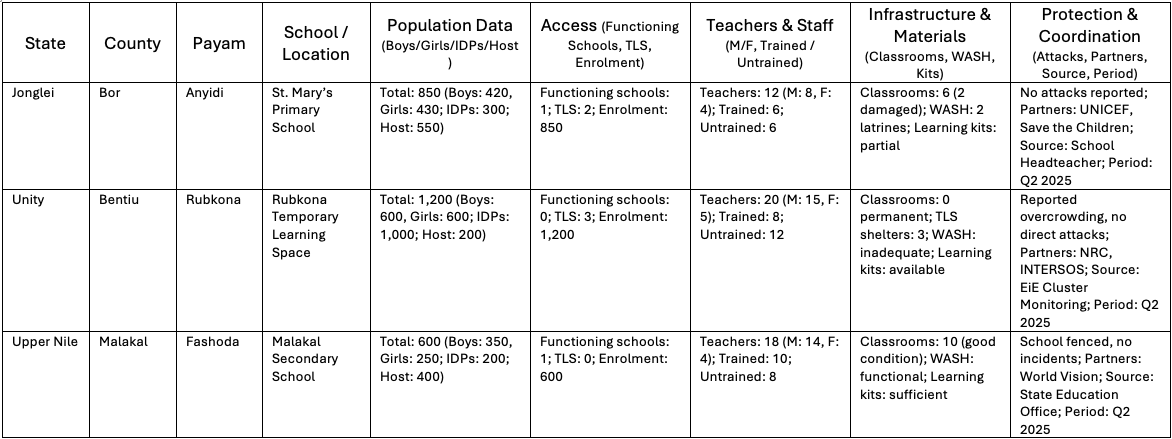
- Designing summary tables for reports
- Preparing visual briefs for coordination meetings
- Hands-on: Create a one-page visual summary from an EiE dataset, and explore AI support for better visuals


